

The early-season landscape
Eight matches into the 2026–27 WSL season, Chelsea and Manchester City are level on 22 points. But their identical points totals hide a clear difference in how they have performed.
Chelsea have produced the league’s strongest underlying performance by a considerable margin. They lead for expected-goal difference, open-play expected-goal difference, big-chance balance and territorial control. Their league-best +22.81 xG difference is more than twice Manchester City’s +8.55.
City have matched Chelsea for results and remain one of the league’s strongest attacking sides, but their overall performances have been less dominant. They rank fourth for xG difference, behind Chelsea, London City Lionesses and Arsenal.
London City are third, six points behind the leading pair, and rank second for xG difference at +10.57. Their underlying numbers support their position among the leading teams and suggest their strong start has been built on more than results alone.
The biggest departure from the preseason picture is Arsenal. Our preseason model made them clear title favourites, but they currently sit seventh, trailing the leaders by 12 points. Their performance metrics tell a very different story. Arsenal rank third for xG difference at +10.00, suggesting they have performed considerably better than their results indicate.
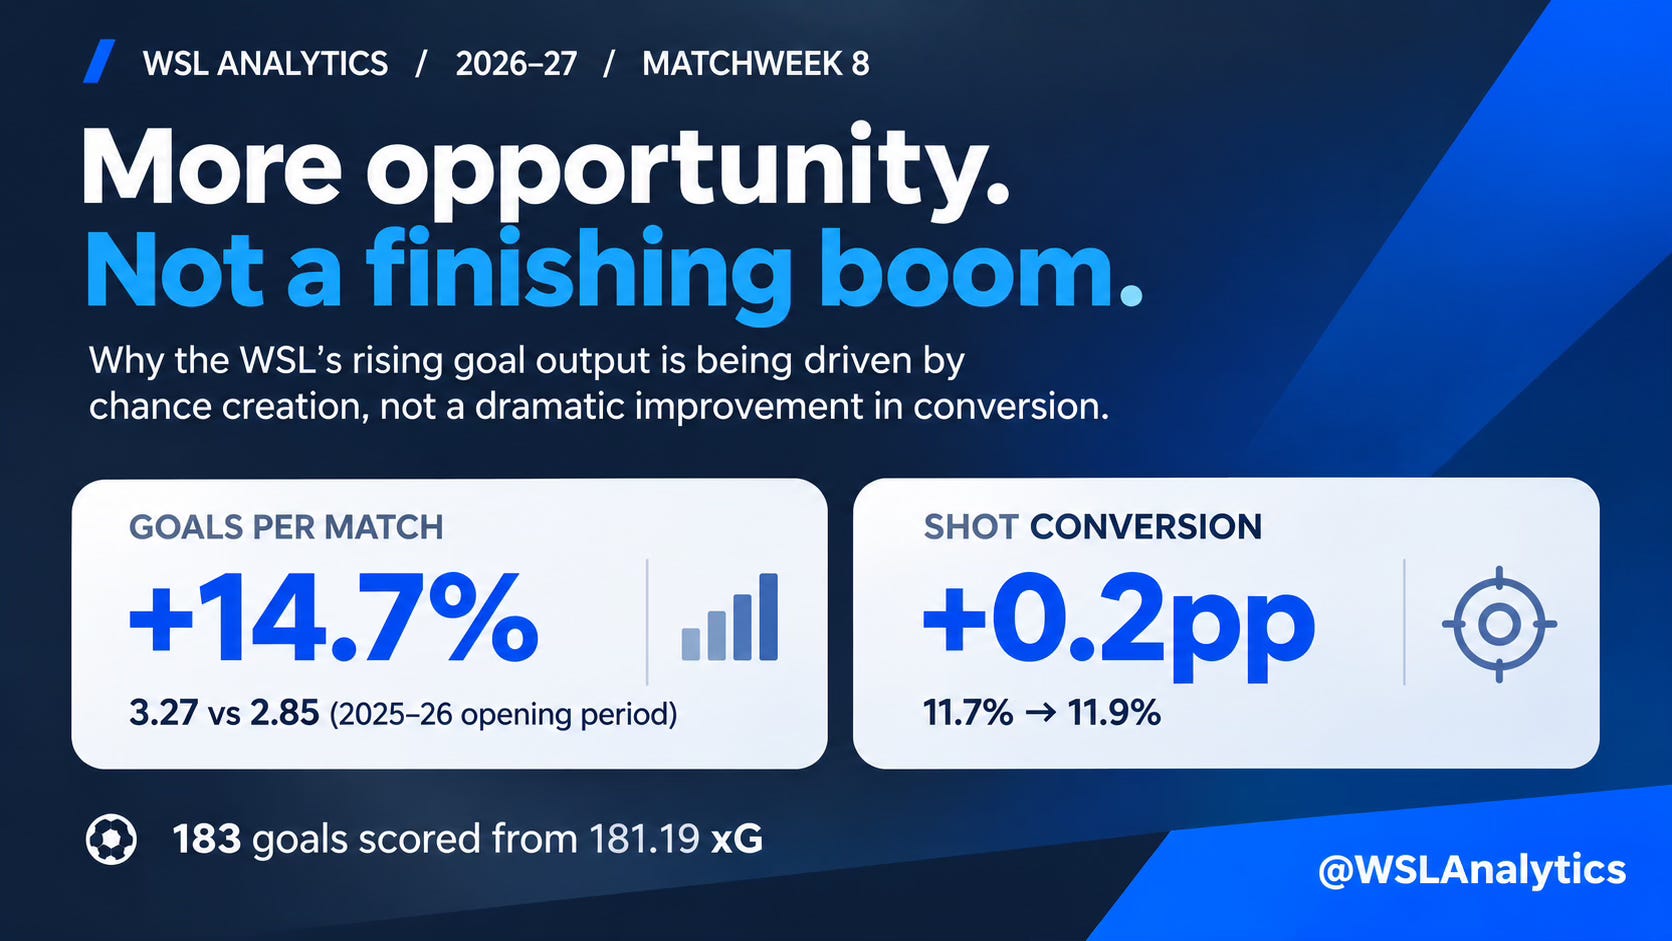
Across the competition, the first 56 matches have produced 183 goals, an average of 3.27 per match. That is up from 2.85 across the equivalent opening period last season. The increase has not come from a sudden finishing boom: expected goals, shots, big chances and opposition-box touches have all risen substantially.
The WSL is scoring more because it is creating substantially more.
The league table also tells some contrasting stories. Arsenal have performed far better than seventh place suggests, while Manchester United and Aston Villa have collected more points than their underlying numbers would normally support.
This report does not declare the season settled after eight matches. It examines what has happened, which patterns appear genuine, what may not last—and which preseason expectations already require revision.
The league is creating more—but the increase is concentrated
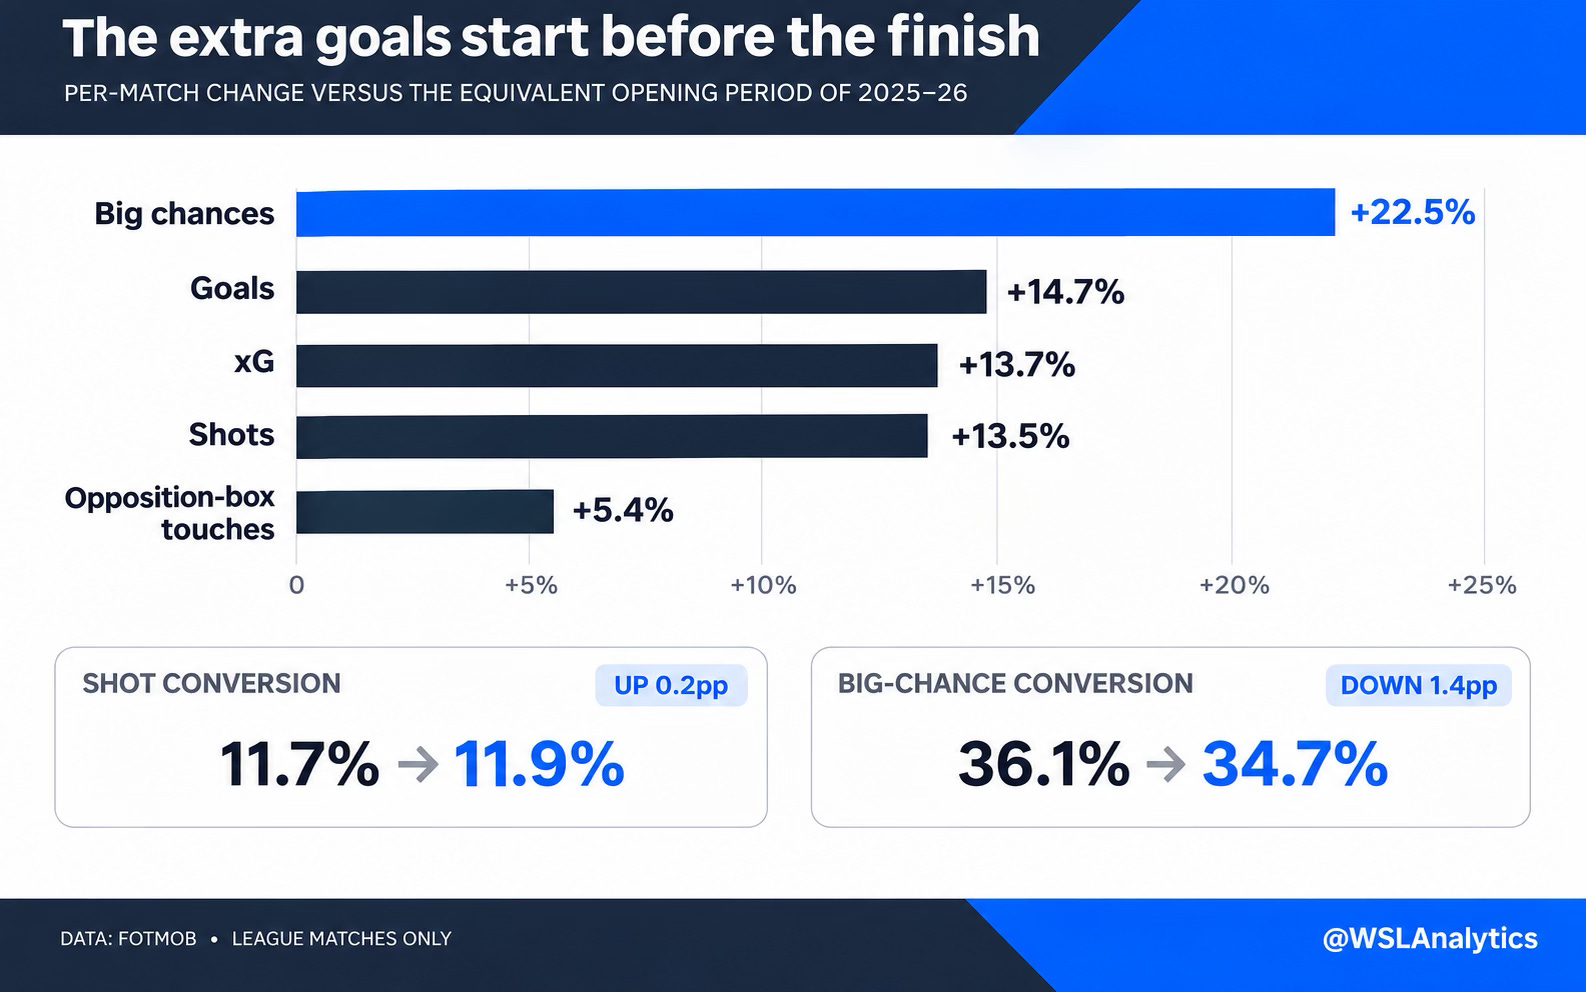
The opening 56 matches have produced 183 goals, an average of 3.27 per match. Across each club’s first eight league matches last season, the WSL averaged 2.85. That represents a 14.7% increase.
The underlying attacking numbers have risen too:
Expected goals: 2.85 to 3.24 per match
Shots: 24.29 to 27.57
Big chances: 4.04 to 4.95
Opposition-box touches: 49.46 to 52.12
But this is not a league-wide improvement shared evenly by every team. The increase has been driven principally by five clubs: Chelsea, Tottenham, London City Lionesses, Liverpool and Brighton.
Across their first eight matches compared with the same stage last season:
Chelsea: 27 goals, up from 15; xG up by 8.49; big chances up by 21
Tottenham: 23 goals, up from 11; xG up by 8.12; big chances up by 14
London City: 20 goals, up from 11; xG up by 10.53; big chances up by 18
Liverpool: 13 goals, up from four; xG up by 6.54; big chances up by 12
Brighton: 15 goals, up from nine; xG up by 5.84; big chances up by seven
Together, those five clubs have scored 48 more goals than they had at the same stage last season. The league-wide increase is only 46, meaning their improvement has more than accounted for the entire rise, with declines elsewhere offsetting part of it.
Their growth is not confined to finishing. Collectively, they have generated 39.52 more xG, 72 more big chances and 294 more shots. Chelsea, Tottenham and London City have made the largest contributions, while Liverpool’s attacking output has also changed dramatically from the same stage last season.
Other leading clubs have not driven the increase in the same way.
Arsenal have taken 33 more shots and recorded 48 more opposition-box touches, but those additional attacks have produced only one more big chance and 1.13 more xG. They have scored 10 fewer goals. Their problem has therefore not been reaching attacking areas; it has been turning that volume into enough high-quality chances and goals.
Manchester United’s decline is more fundamental. They have scored 10 fewer goals, while their xG has fallen by 7.14, with 11 fewer big chances and 40 fewer shots. Their reduced scoring is supported by a clear drop in attacking production.
Manchester City, meanwhile, have scored two more goals, but their xG has fallen slightly, their big-chance total is unchanged and they have taken three fewer shots. They remain one of the league’s strongest attacks, but they are not among the teams pushing the competition-wide numbers upwards.
Expansion has also contributed. Birmingham City, Charlton Athletic and Crystal Palace have combined for 20 goals from 20.65 xG. By comparison, Leicester City—the only club from last season no longer in the WSL—had scored five goals from 4.59 xG at the same stage. But the increased scoring rate cannot be explained by the additional clubs alone. The largest change has come from a group of established teams creating substantially more—and better—opportunities.
Shot conversion has moved only slightly, from 11.7% to 11.9%, while big-chance conversion has actually fallen from 36.1% to 34.7%. The 183 goals have come from 181.19 xG, an overperformance of only 1.81 goals across 56 matches.
The WSL is scoring more, but not because every attack has improved. A small group of clubs has moved the league’s attacking baseline.
Different teams are creating in different ways
The teams driving the attacking increase have not followed the same model.
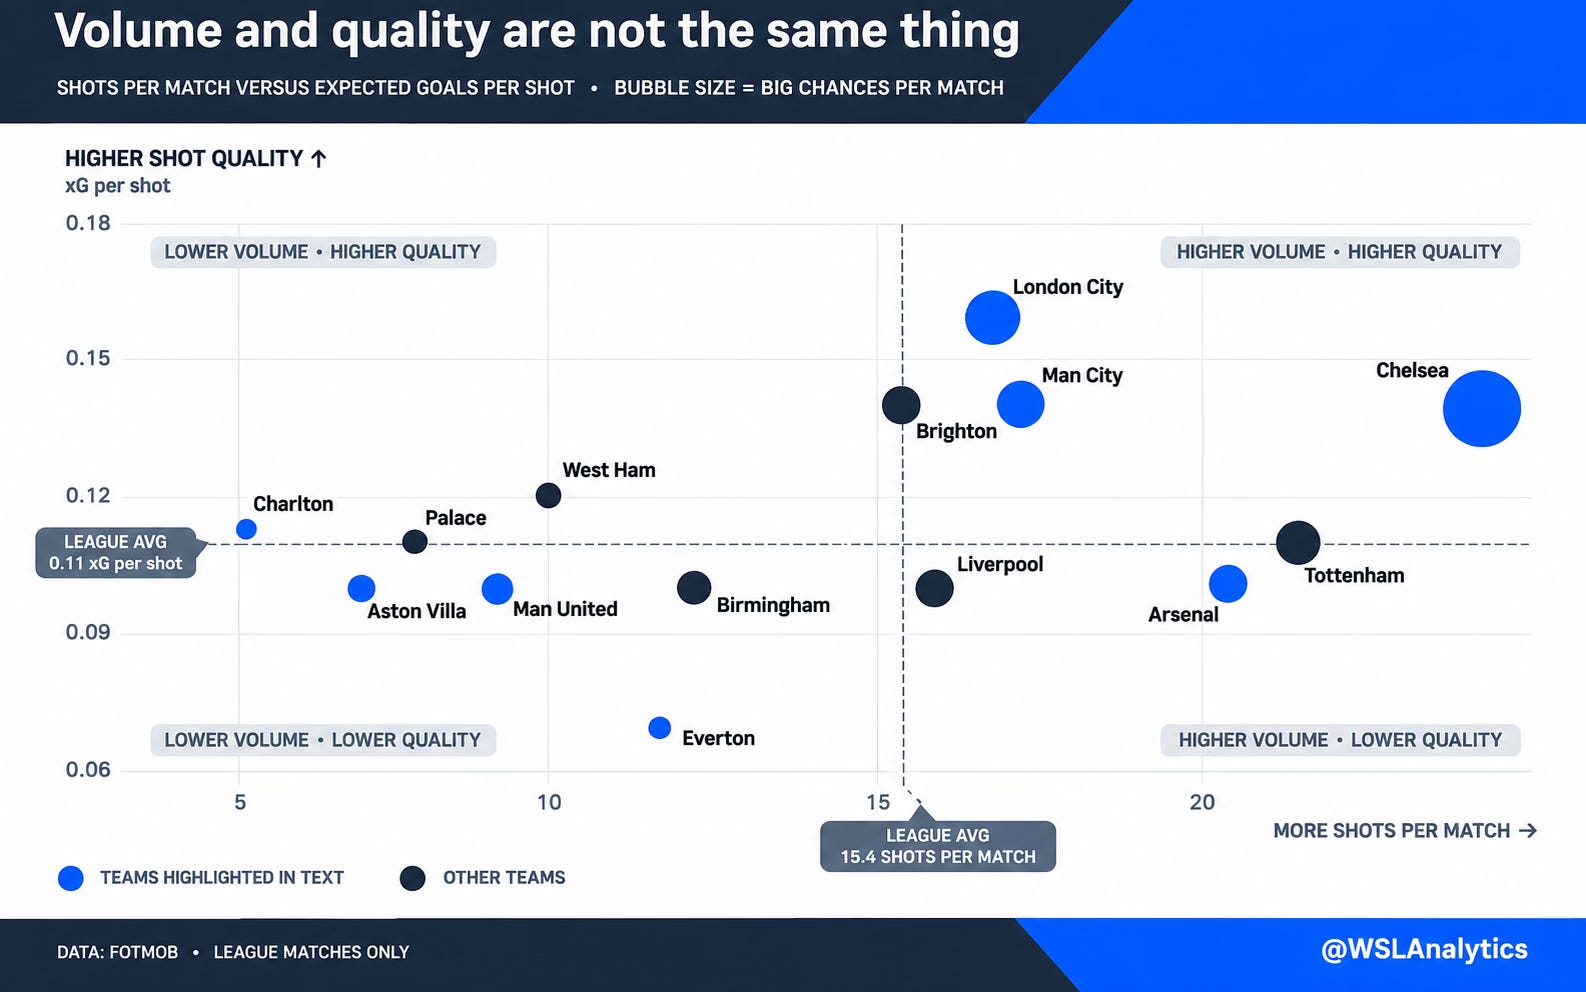
Chelsea have built the league’s most complete attack, combining its highest shot volume with sustained territorial pressure and 45 big chances. London City have relied less on volume and more on shot quality: their 0.16 xG per attempt is the highest in the league, while their 36 big chances rank second only to Chelsea.
Tottenham’s improvement has been driven by volume and execution. They rank second for shots and have scored 23 goals from 18.27 xG. Their attacking transformation appears genuine, although their league-high +4.73 finishing margin is unlikely to persist at the same level.
Arsenal also generate substantial volume, but it has not consistently become high-quality opportunities. Their 163 shots and 367 opposition-box touches have produced 20 big chances—fewer than half Chelsea’s total. They are reaching advanced areas regularly without extracting enough value from those attacks.
Manchester City occupy a more balanced position, combining moderate volume with good shot quality. Manchester United and Aston Villa sit at the opposite end of the spectrum: both have scored more than their underlying attacking production would normally support, despite generating relatively few shots.
Everton’s difficulty is primarily chance quality. Their 92 attempts have produced only 6.31 xG—approximately 0.07 xG per shot, the lowest rate in the league. Charlton’s problem is more fundamental: they have generated only 3.98 xG across eight matches, including 1.54 from open play.
More attacking football does not mean every team is attacking in the same way.
Defence is prevention first—and rescue second
The league’s attacking rise inevitably has a defensive counterpart. Across the opening eight matches, teams have conceded more shots, more expected goals and, most significantly, more big chances than at the same stage last season.
On a per-team, per-match basis:
xG conceded has risen from 1.44 to 1.62
Shots conceded have risen from 12.15 to 13.79
Big chances conceded have risen from 2.02 to 2.47
But, as with the attacking numbers, this has not been a league-wide change shared evenly by every club.
The composition of the competition matters. Birmingham City, Charlton Athletic and Crystal Palace—the three additions to this season’s expanded league—have conceded a combined 59 goals from 62.06 xG. Leicester City, the only club from last season no longer in the WSL, had conceded 13 goals from 11.08 xG after eight matches.
The other 11 clubs have conceded exactly 124 goals collectively in both seasons. Their combined xG conceded has actually fallen from 126.92 to 119.13, while their shots conceded have dropped from 1,063 to 1,026.
The overall defensive numbers have worsened, but the decline is heavily concentrated among the league’s new entrants.
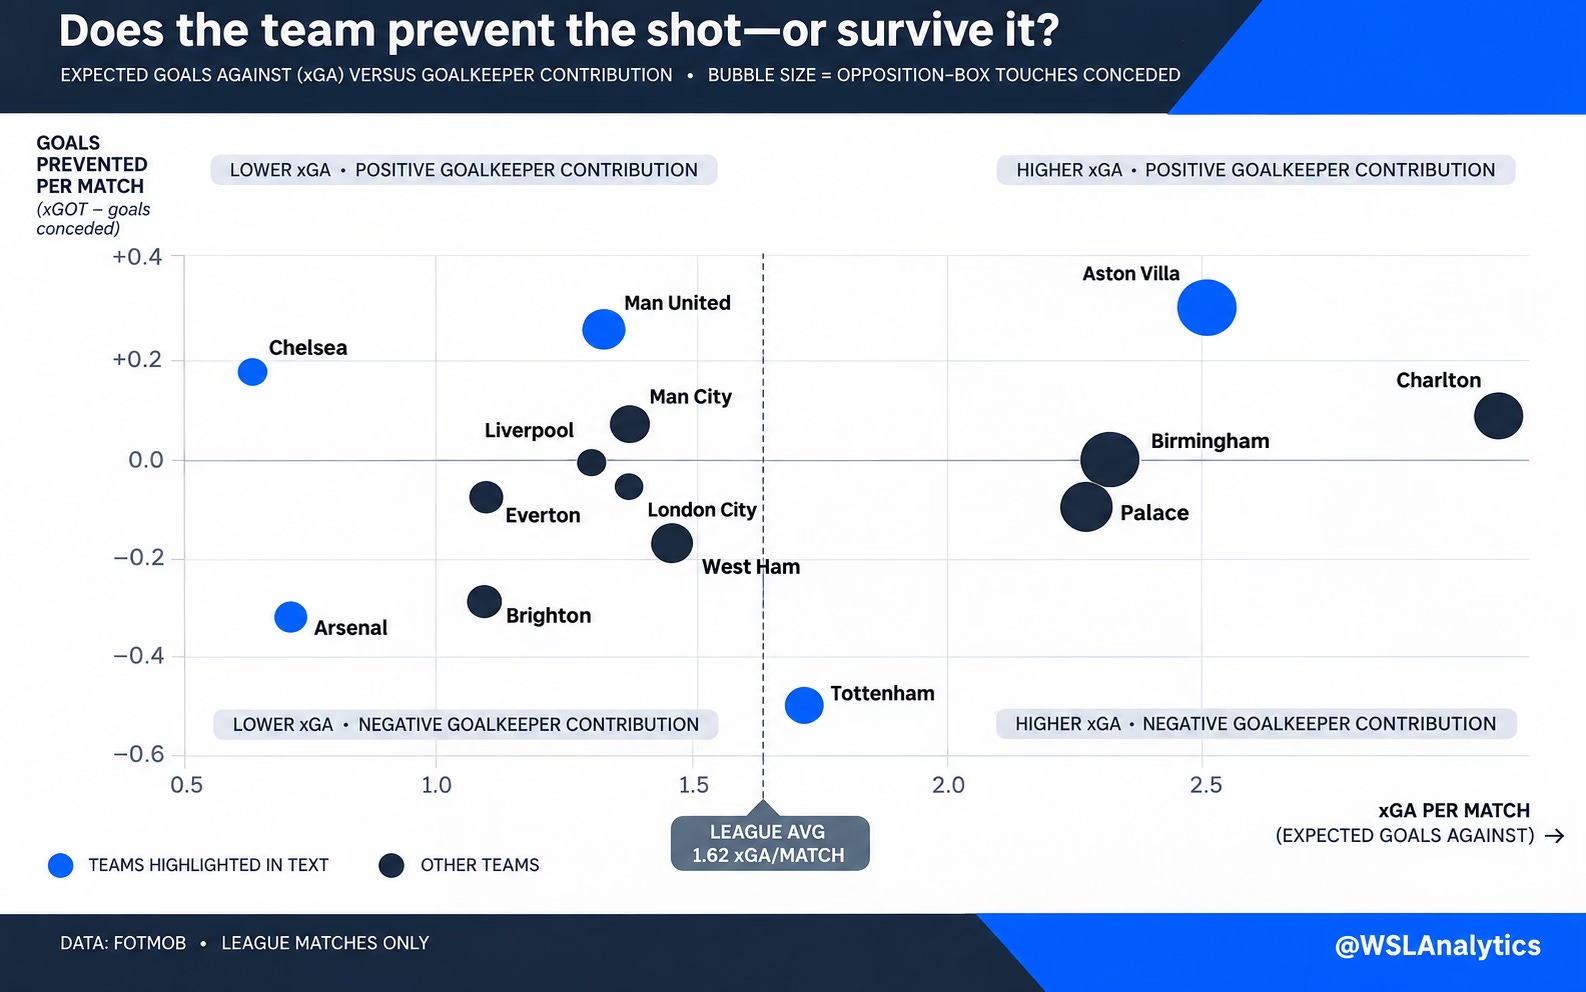
That does not mean the returning clubs have all defended equally well. Some have become considerably better at preventing danger; others have survived because of their goalkeepers; and a few have been exposed more frequently than they were last season.
Chelsea are allowing almost nothing
Chelsea have produced the league’s strongest defensive process. They have conceded only 4.85 xG and five big chances across eight matches.
At the same stage last season, they had allowed 8.89 xG and 12 big chances. They conceded four goals in both periods, but that identical outcome hides a substantial improvement in the quality of their defending.
Chelsea are not merely conceding fewer goals than most teams. They are limiting the opportunities from which goals would normally be scored.
Arsenal rank second for xG conceded at 5.85, down from 8.55 last season. They have also reduced their shots conceded from 71 to 48 and their big chances faced from 16 to 12.
Yet Arsenal have conceded nine goals—one more than at the same stage last season. Their goalkeepers have allowed approximately 2.59 more goals than the post-shot quality faced would suggest.
That distinction matters. Arsenal’s defensive structure has generally prevented opponents from creating much, but the relatively small number of shots that have reached their goal have caused disproportionate damage.
Brighton present a similar contrast. Their xG conceded has fallen from 11.16 to 8.87, while their shots conceded have dropped from 110 to 75. Despite that improvement, they have conceded 11 goals, up from nine, with a goals-prevented figure of approximately −2.15.
Both teams demonstrate why goals conceded alone cannot fully measure a defence. The process before the shot and the outcome after it can tell very different stories.
Everton have made the largest improvement
Everton have recorded the largest reduction in xG conceded among the returning clubs:
Goals conceded: 16 to nine
xG conceded: 13.62 to 8.92
Shots conceded: 96 to 85
Big chances conceded: 19 to 17
Their improvement has come from two places. They are allowing opponents fewer and lower-quality opportunities, while their goalkeeping is no longer compounding those defensive problems. Everton’s goals-prevented figure has improved from approximately −4.38 to −0.57.
London City have also taken a significant step forward. They have conceded 10 goals rather than 18, while reducing their xG conceded from 14.74 to 11.38 and their shots faced from 105 to 74.
West Ham remain vulnerable, but their defensive process has improved too. Their xG conceded has fallen from 16.26 to 11.93, their big chances faced from 25 to 18 and their goals conceded from 19 to 14.
These improvements help explain why the established clubs, taken together, have not suffered the broad defensive collapse suggested by the league-wide averages.
Aston Villa are being rescued; City are allowing more
Aston Villa have experienced the sharpest defensive decline among the returning clubs. Their xG conceded has risen from 12.34 to 20.06, while:
Shots conceded have increased from 106 to 195
Big chances conceded have increased from 17 to 26
Goals conceded have increased from seven to 15
Their goalkeepers have prevented approximately 1.98 goals, meaning their defensive record could have been worse without that intervention. Villa are not preventing danger effectively; they are being partially rescued from it.
Manchester City’s defensive process has also weakened. Their xG conceded has risen from 6.92 to 11.14, their shots faced from 64 to 94 and their big chances conceded from nine to 18.
They have conceded only one more goal than at the same stage last season, but opponents are reaching substantially more—and better—opportunities. Their goals-conceded total has not yet reflected the full extent of the change.
Manchester United have allowed only slightly more xG, rising from 9.85 to 11.09, but the quality of the chances conceded is more concerning. Their big chances faced have increased from 13 to 20, and they have conceded 11 goals rather than six. A positive goalkeeper contribution of approximately 1.23 goals has prevented the total from rising further.
Tottenham present another important warning. They have faced eight fewer shots than at the same stage last season, but their big chances conceded have almost doubled from 12 to 23. Their problem is not the overall volume of attempts—it is the quality of the opportunities opponents are reaching.
Their improved attack has powered an excellent start, but it has been accompanied by a less secure defensive process.
Strong defending begins by preventing dangerous shots. Goalkeeping determines what happens when that prevention fails.
The real table: where results and performance disagree
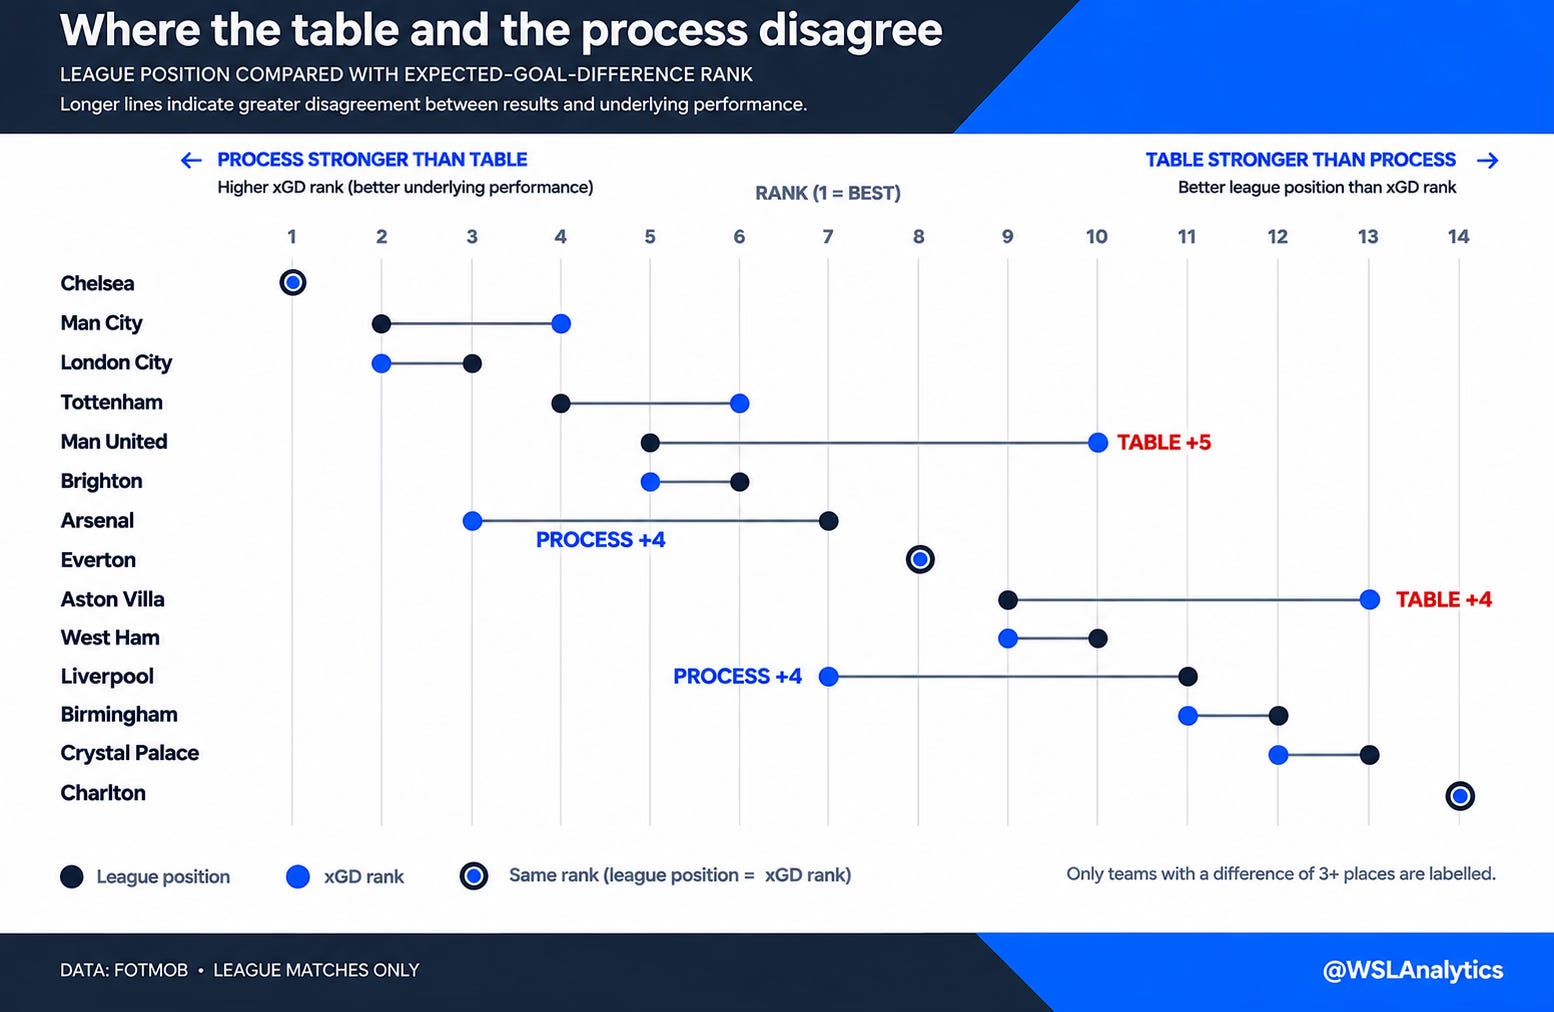
Expected-goal difference is not an alternative league table. It does not award or remove points. It does, however, show which teams are consistently producing the better opportunities—and where results currently require something more volatile.
Chelsea have taken 22 points with a league-best +22.81 xG difference. Their actual goal difference is +23, closely aligned with their performance. They also lead for open-play xG difference, big-chance balance and opposition-box-touch balance.
London City rank second for xGD at +10.57, despite sitting six points behind the leading pair. Arsenal rank third at+10.00, while Manchester City rank fourth at +8.55.
Arsenal provide the clearest disagreement between process and result. They sit seventh with 10 points and a −1 goal difference despite creating 15.85 xG and conceding only 5.85. Their actual goal difference is therefore 11 goals worse than their xG difference, the largest negative gap in the league.
The Aston Villa draw made that contradiction even larger. Arsenal produced 28 shots, 56 opposition-box touches and 2.61 xG while allowing one shot worth 0.07 xG. The performance was dominant; the outcome was not.
Brighton sit sixth after three consecutive victories and rank fifth for xGD at +7.99. Their league position broadly reflects the strength of their performances.
Manchester United and Aston Villa remain on the other side of the divide.
United are fifth with 12 points despite a −4.02 xG difference, which ranks tenth. Villa have 10 points but rank 13th at −14.38. Opponents have outshot Villa 195–55 and recorded 368 opposition-box touches to Villa’s 101. Efficient finishing and exceptional goalkeeping have repeatedly protected them from that workload.
None of this makes those points undeserved, nor does it guarantee that Arsenal will recover automatically. It identifies which results are supported by repeatable control and which currently require finishing, goalkeeping or isolated moments to keep working in the same direction.
The players shaping the early season
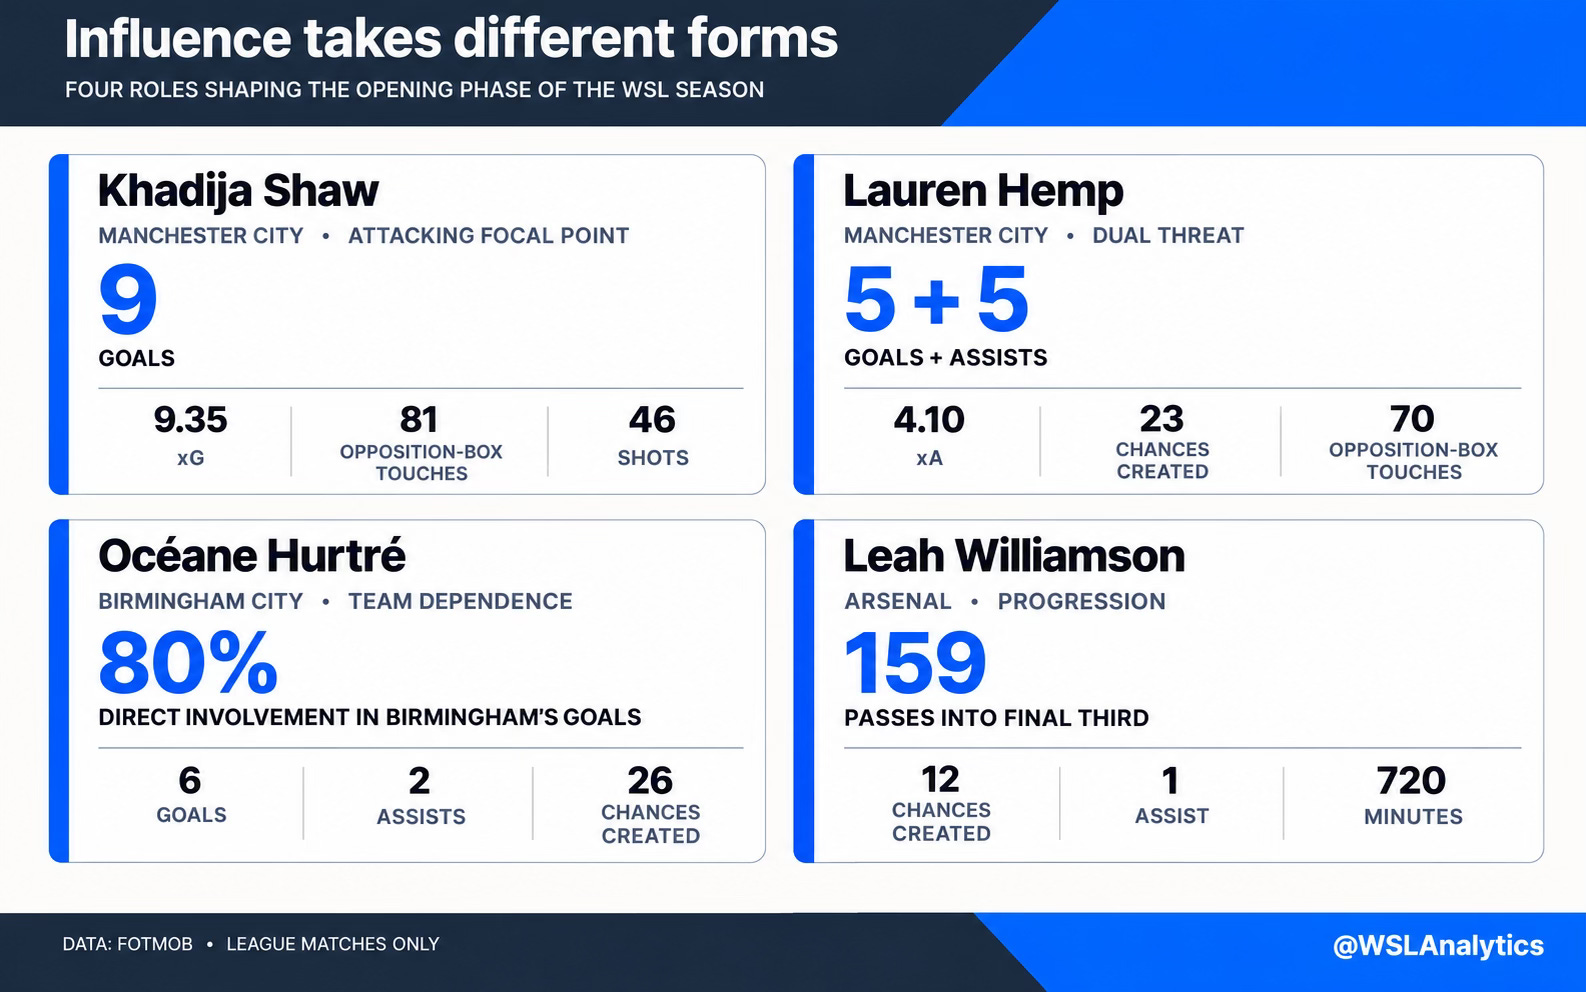
Manchester City have the league’s clearest scorer–creator partnership.
Khadija Shaw leads with nine goals from 9.35 xG. She has attempted 46 shots and recorded 81 opposition-box touches, both league highs. Her goals are not being built on a run of improbable finishes; she is repeatedly receiving the ball in positions from which goals should be expected.
Lauren Hemp has produced five goals and five assists, alongside 4.10 expected assists, 23 chances created and 70 opposition-box touches. She creates for others while repeatedly entering scoring areas herself.
Océane Hurtré carries two attacking roles for Birmingham. She has six goals, two assists and a league-leading 26 chances created. She has been directly involved in eight of Birmingham’s 10 goals—an 80% share. Her scoring contains a finishing premium, but the creative production means her influence is broader than conversion alone.
London City have distributed responsibility more widely. Daniëlle van de Donk has three goals and four assists, while Kadidiatou Diani has three goals, three assists and 3.46 xA.
Chelsea have also spread their threat. Melvine Malard has six goals after her brace at Charlton. Ellie Carpenter has four goals, 2.80 xA, 19 chances created and 56 opposition-box touches from a nominally defensive position.
Leah Williamson leads the league with 159 passes into the final third. This supports Arsenal’s wider territorial dominance, but progression is not the same as penetration. Arsenal still need the movements and final actions ahead of her to turn those entries into enough high-value opportunities.
What our preseason predictions got right—and wrong
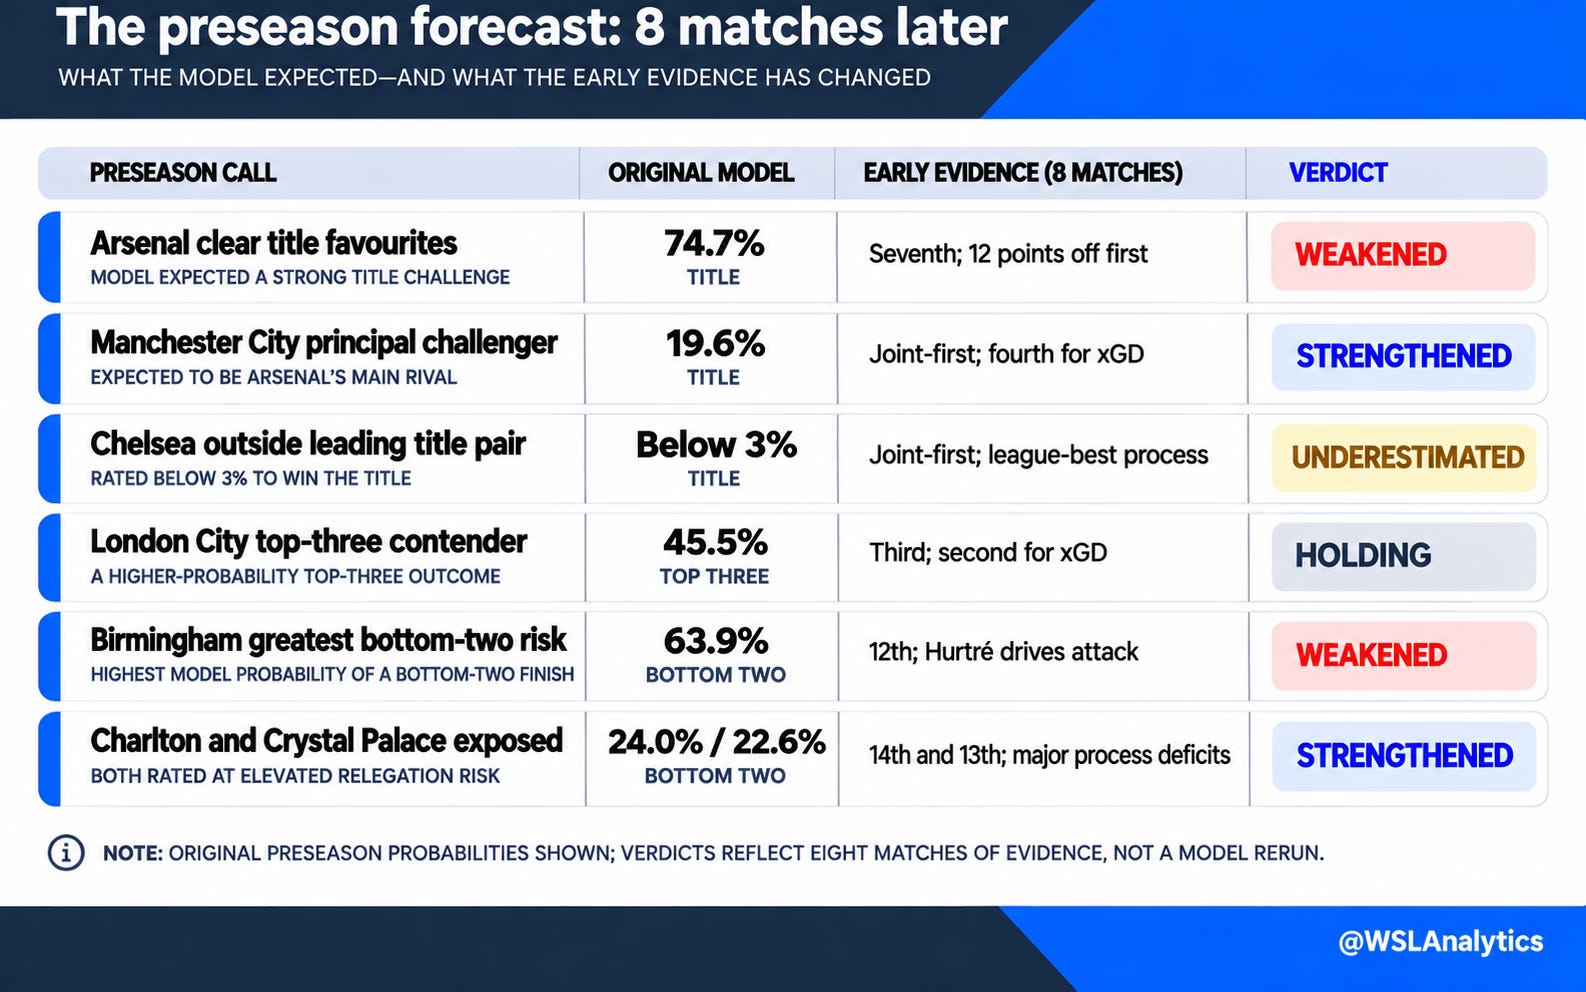
Our preseason model made Arsenal clear title favourites at 74.7%, with Manchester City second at 19.6% and every other club below 3%.
That forecast has not survived intact. Arsenal are seventh and 12 points behind the leaders. Their +10.00 xGD makes the performance stronger than the table suggests, but the size of the deficit prevents them remaining clear favourites.
City’s position as a principal challenger has strengthened through results, although fourth place for xGD adds caution. The largest miss remains Chelsea. The model treated them primarily as a top-three contender; they are joint-top with comfortably the league’s strongest process.
The model gave London City a 45.5% chance of finishing in the top three, marginally ahead of Chelsea at 44.9%. Both occupy the top three and both have produced top-three underlying numbers. That part is holding up nicely even though the expected hierarchy is not.
Birmingham were considered the most likely bottom club, with a 63.9% chance of occupying the bottom two. They sit 12th, but have offered more attacking resistance than projected through Hurtré. Their defensive workload still leaves the risk unresolved.
Charlton now carry the clearest warning. They are without a point and rank last with a −20.88 xGD. Crystal Palace also face a major defensive burden, although six points give them some protection.
The early-season crowd picture
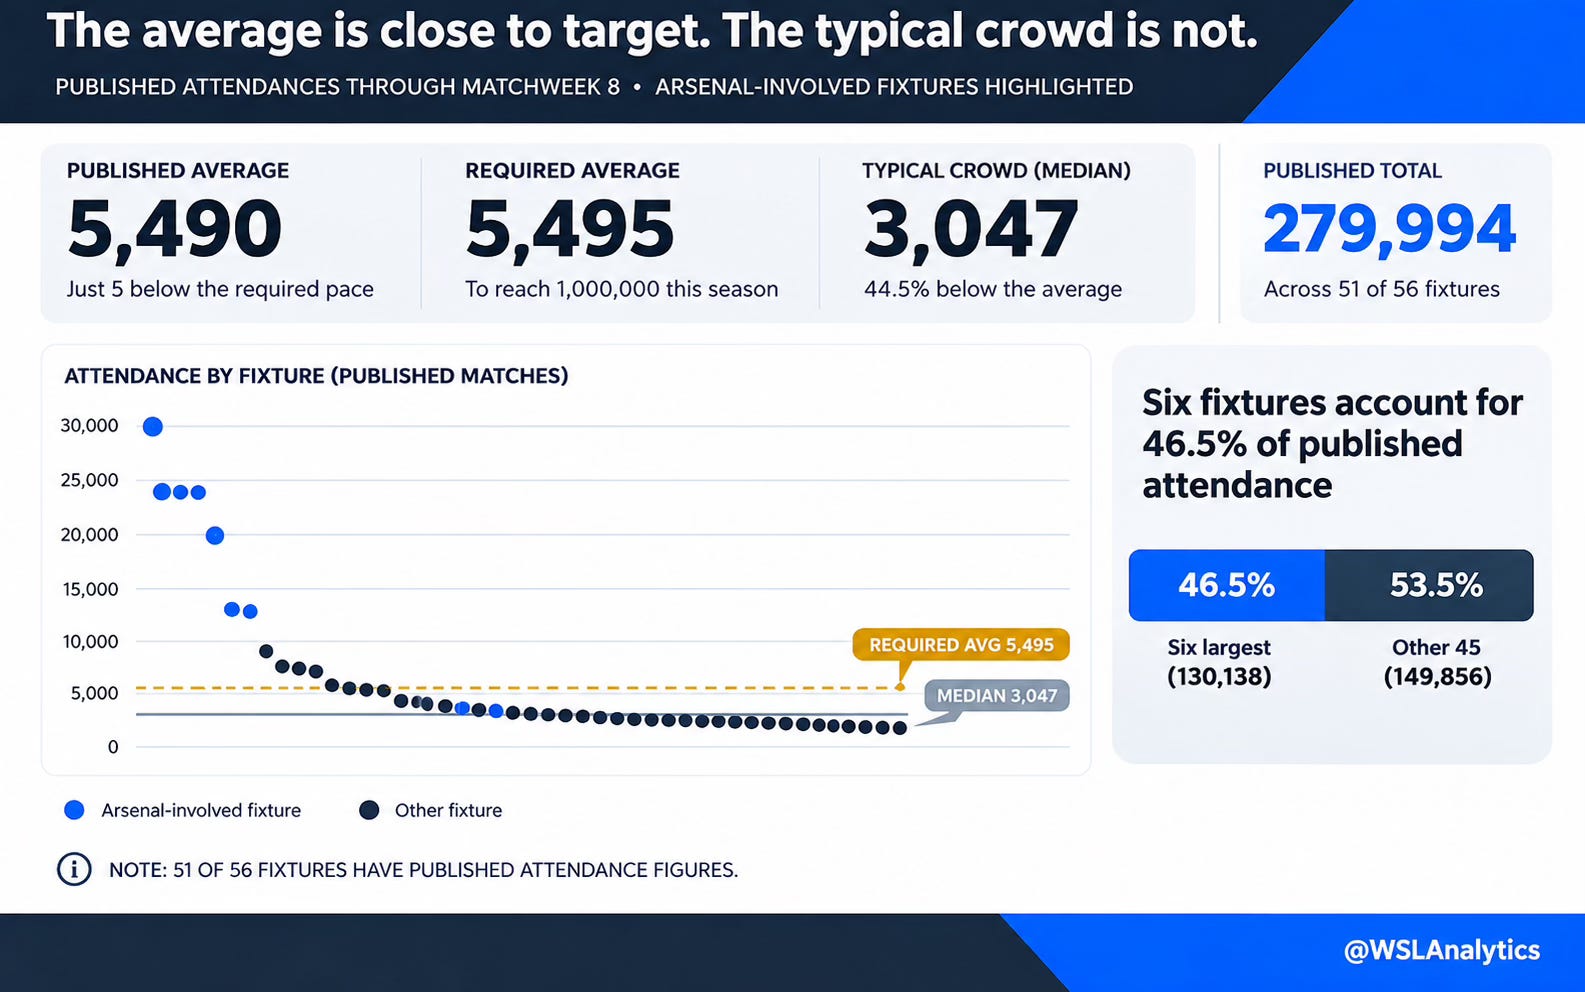
Attendance figures are available for 51 of the 56 completed matches. Those fixtures have drawn 279,994 spectators—28.0% of our Road to One Million target.
The average attendance is 5,490, which is five below the season-long average of 5,495 required to reach one million. But the median is only 3,047. The average is 80% higher than the median, showing how strongly major fixtures lift the headline number.
The six largest crowds have all involved Arsenal:
Arsenal v Manchester United — 29,853
Arsenal v Crystal Palace — 23,900
Arsenal v Aston Villa — 23,891
Arsenal v Birmingham City — 19,426
Chelsea v Arsenal — 19,349
Tottenham v Arsenal — 13,719
Together, they attracted 130,138 spectators—46.5% of the confirmed total. Arsenal’s four home fixtures alone contributed 97,070, or 34.7%.
The WSL average is close to the required pace, but the typical crowd remains considerably smaller.
The early verdict
Eight matches per club are enough to reveal patterns, but not enough to make the rest of the season inevitable.
Chelsea have built the strongest foundation. City are level on points, but London City and Arsenal rank above them for xGD. London City have provided substantial evidence that they belong in the leading group. Arsenal are the clearest example of why result and performance must be examined together: some correction appears likely, but recovery cannot be assumed.
Brighton’s results broadly reflect their strong underlying performances. United and Villa need greater control before efficiency stops covering their deficits. Tottenham’s attack is highly productive, but their scorelines are being distorted by finishing and goalkeeping moving in opposite directions.
Our preseason expectations have therefore changed. Chelsea were underestimated. Arsenal’s margin for error has narrowed sharply. London City’s case has strengthened. Birmingham have offered more attacking resistance than projected, while Charlton carry the clearest relegation warning.
The opening eight matches have not settled the WSL. They have clarified what the rest of the season must prove.